Network Graph rendering : Isopleths with Gmic
Mathieu Jacomy is currently experimenting a type of graph rendering using a technic called “Hillshading”, a demo is accessible here https://observablehq.com/d/7d19c2d05caf9fb2 . The idea of this concept is to add information to enhance the readability of the graph, especially when there is condensed clusters of nodes.
The current script is working mostly in javascript with D3.js. I wanted to find a way to do it without any JS, locally in my computer. Then I remember a wonderful tool called GMIC that can do a lot of advanced image processing.
To simplify the things, we are going to remove the shading part of the hillshading, which on my opinion isn’t the critical part of the entire process described by Mathieu Jacomy. At the end, hillshading are just shaded Isopleths , the line you see in a map that indicate the altitude. I should be enough for the scope of the script we want to acheive.
To use the script we need to have 2 applications :
- GMIC, we need the CLI version of the tool. It’s available for Windows and Linux.
- Gephi , for generating graph.
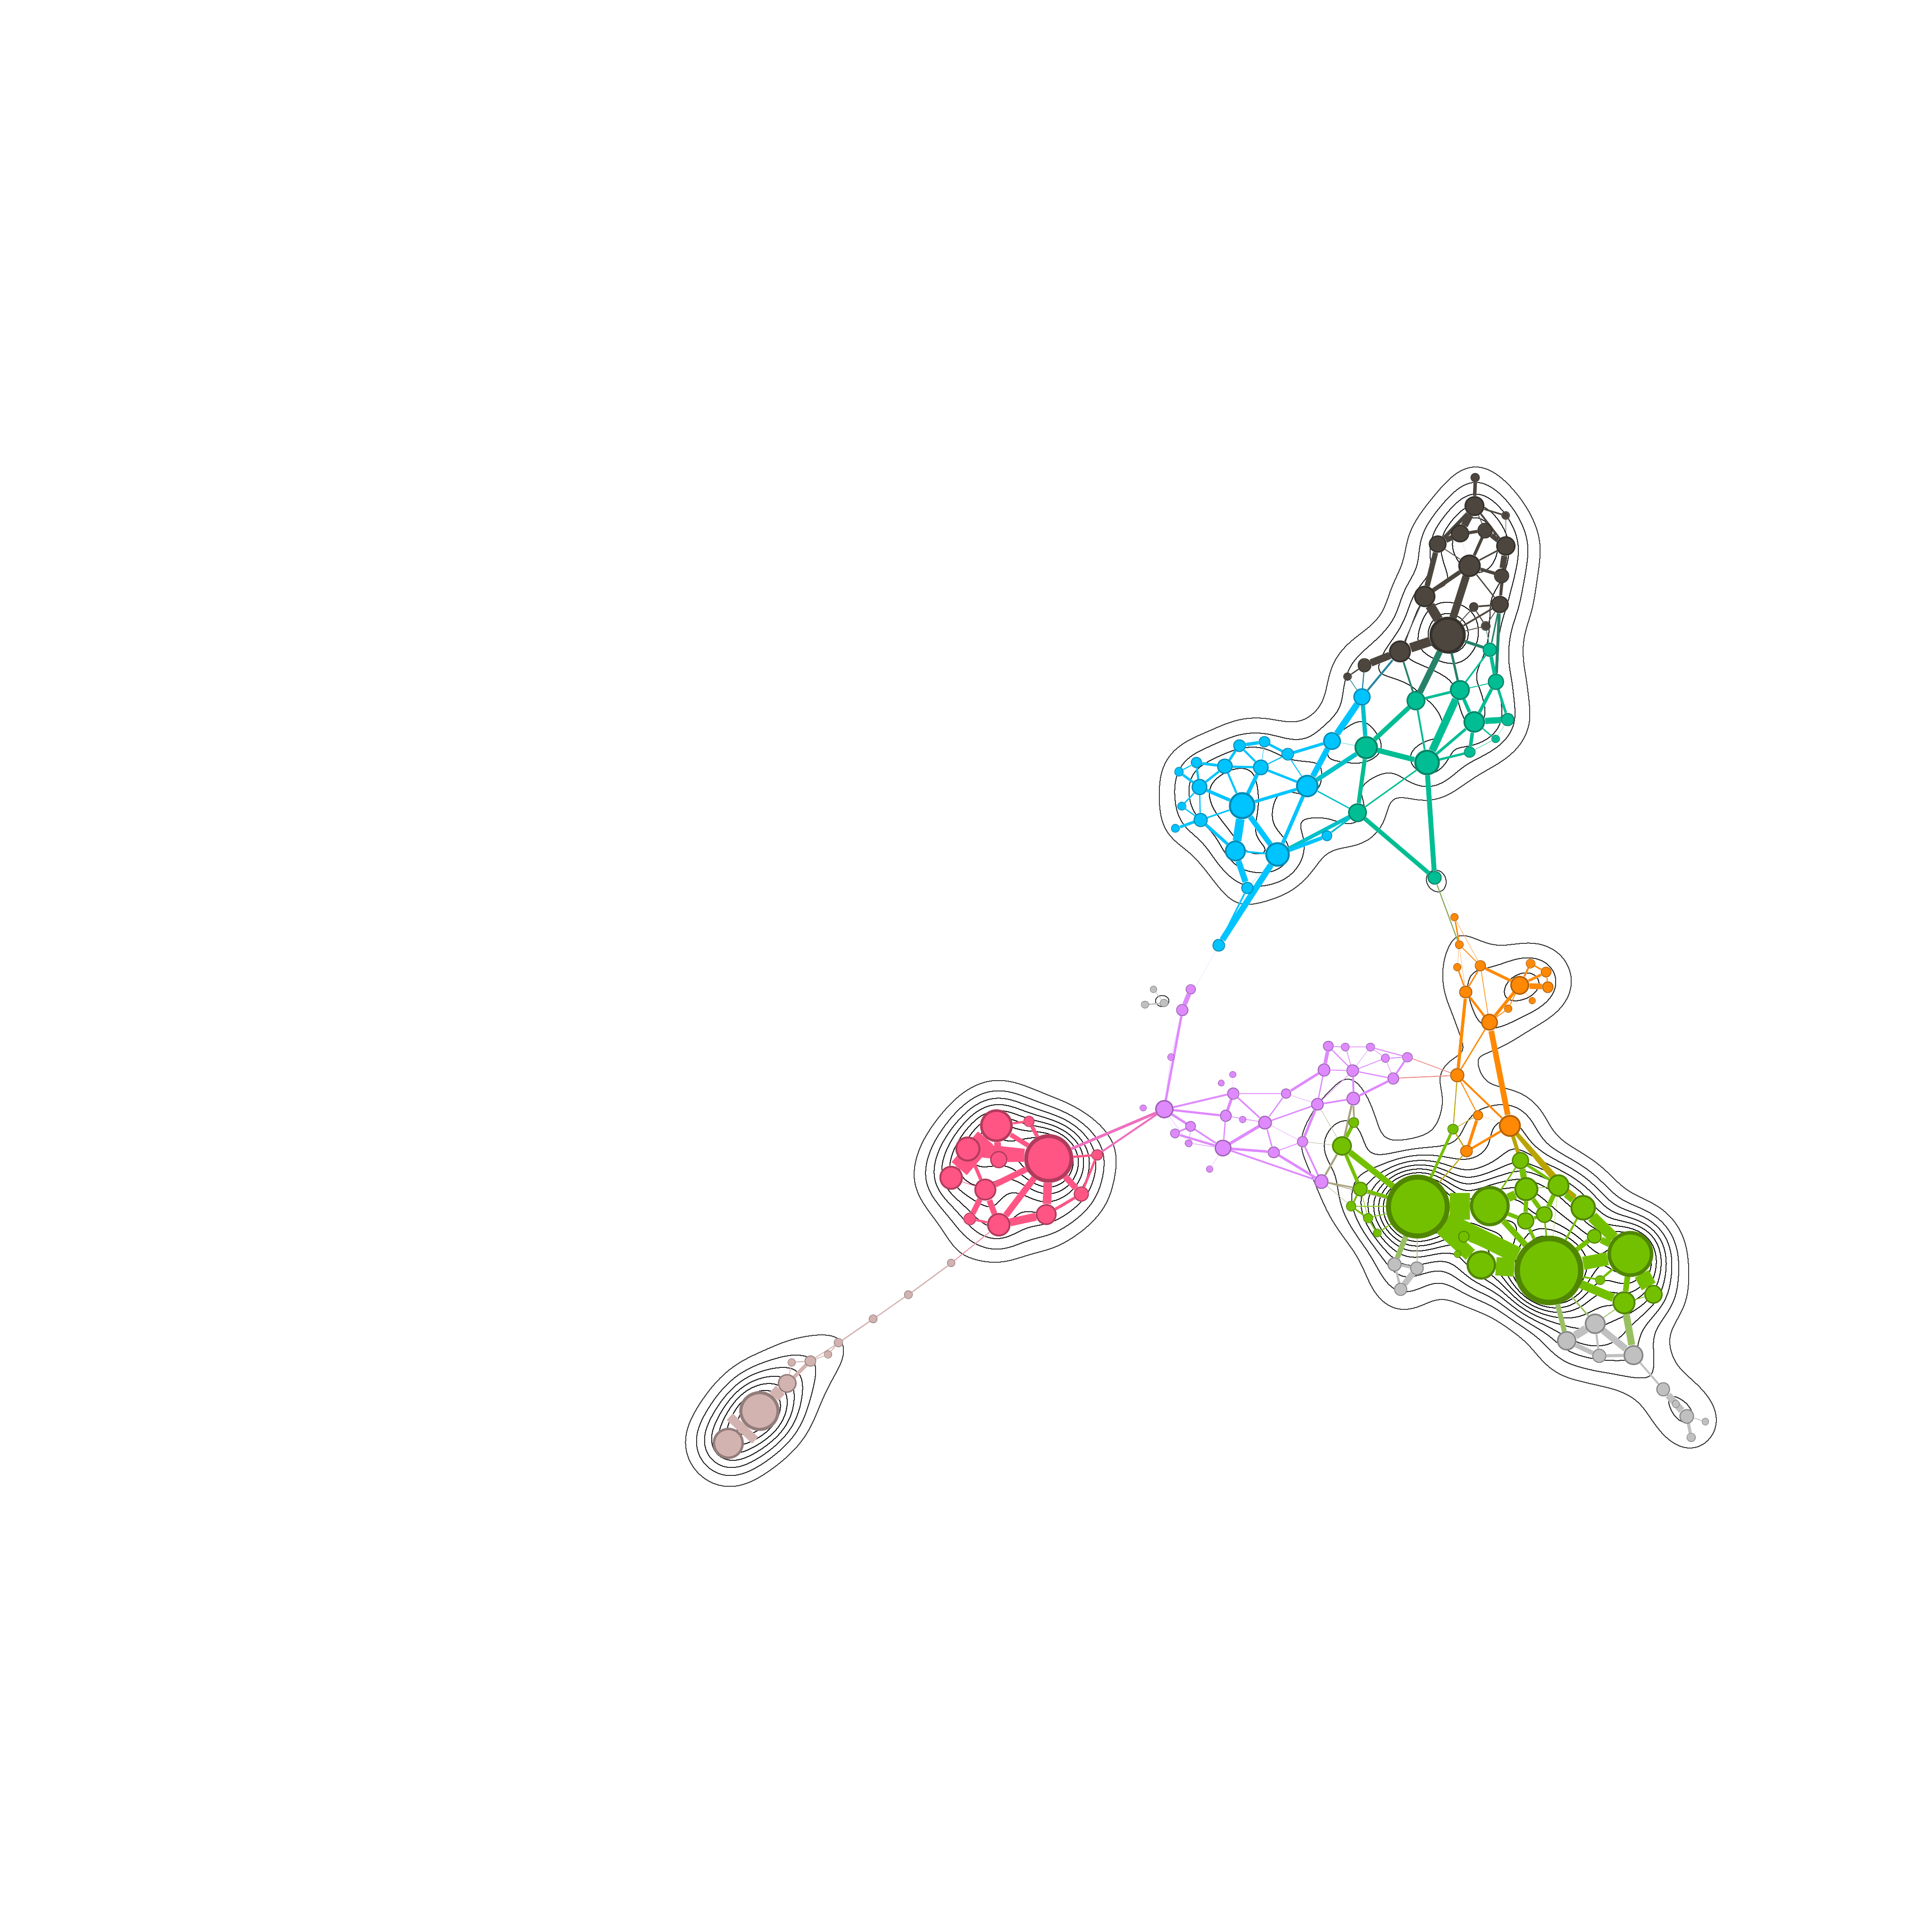
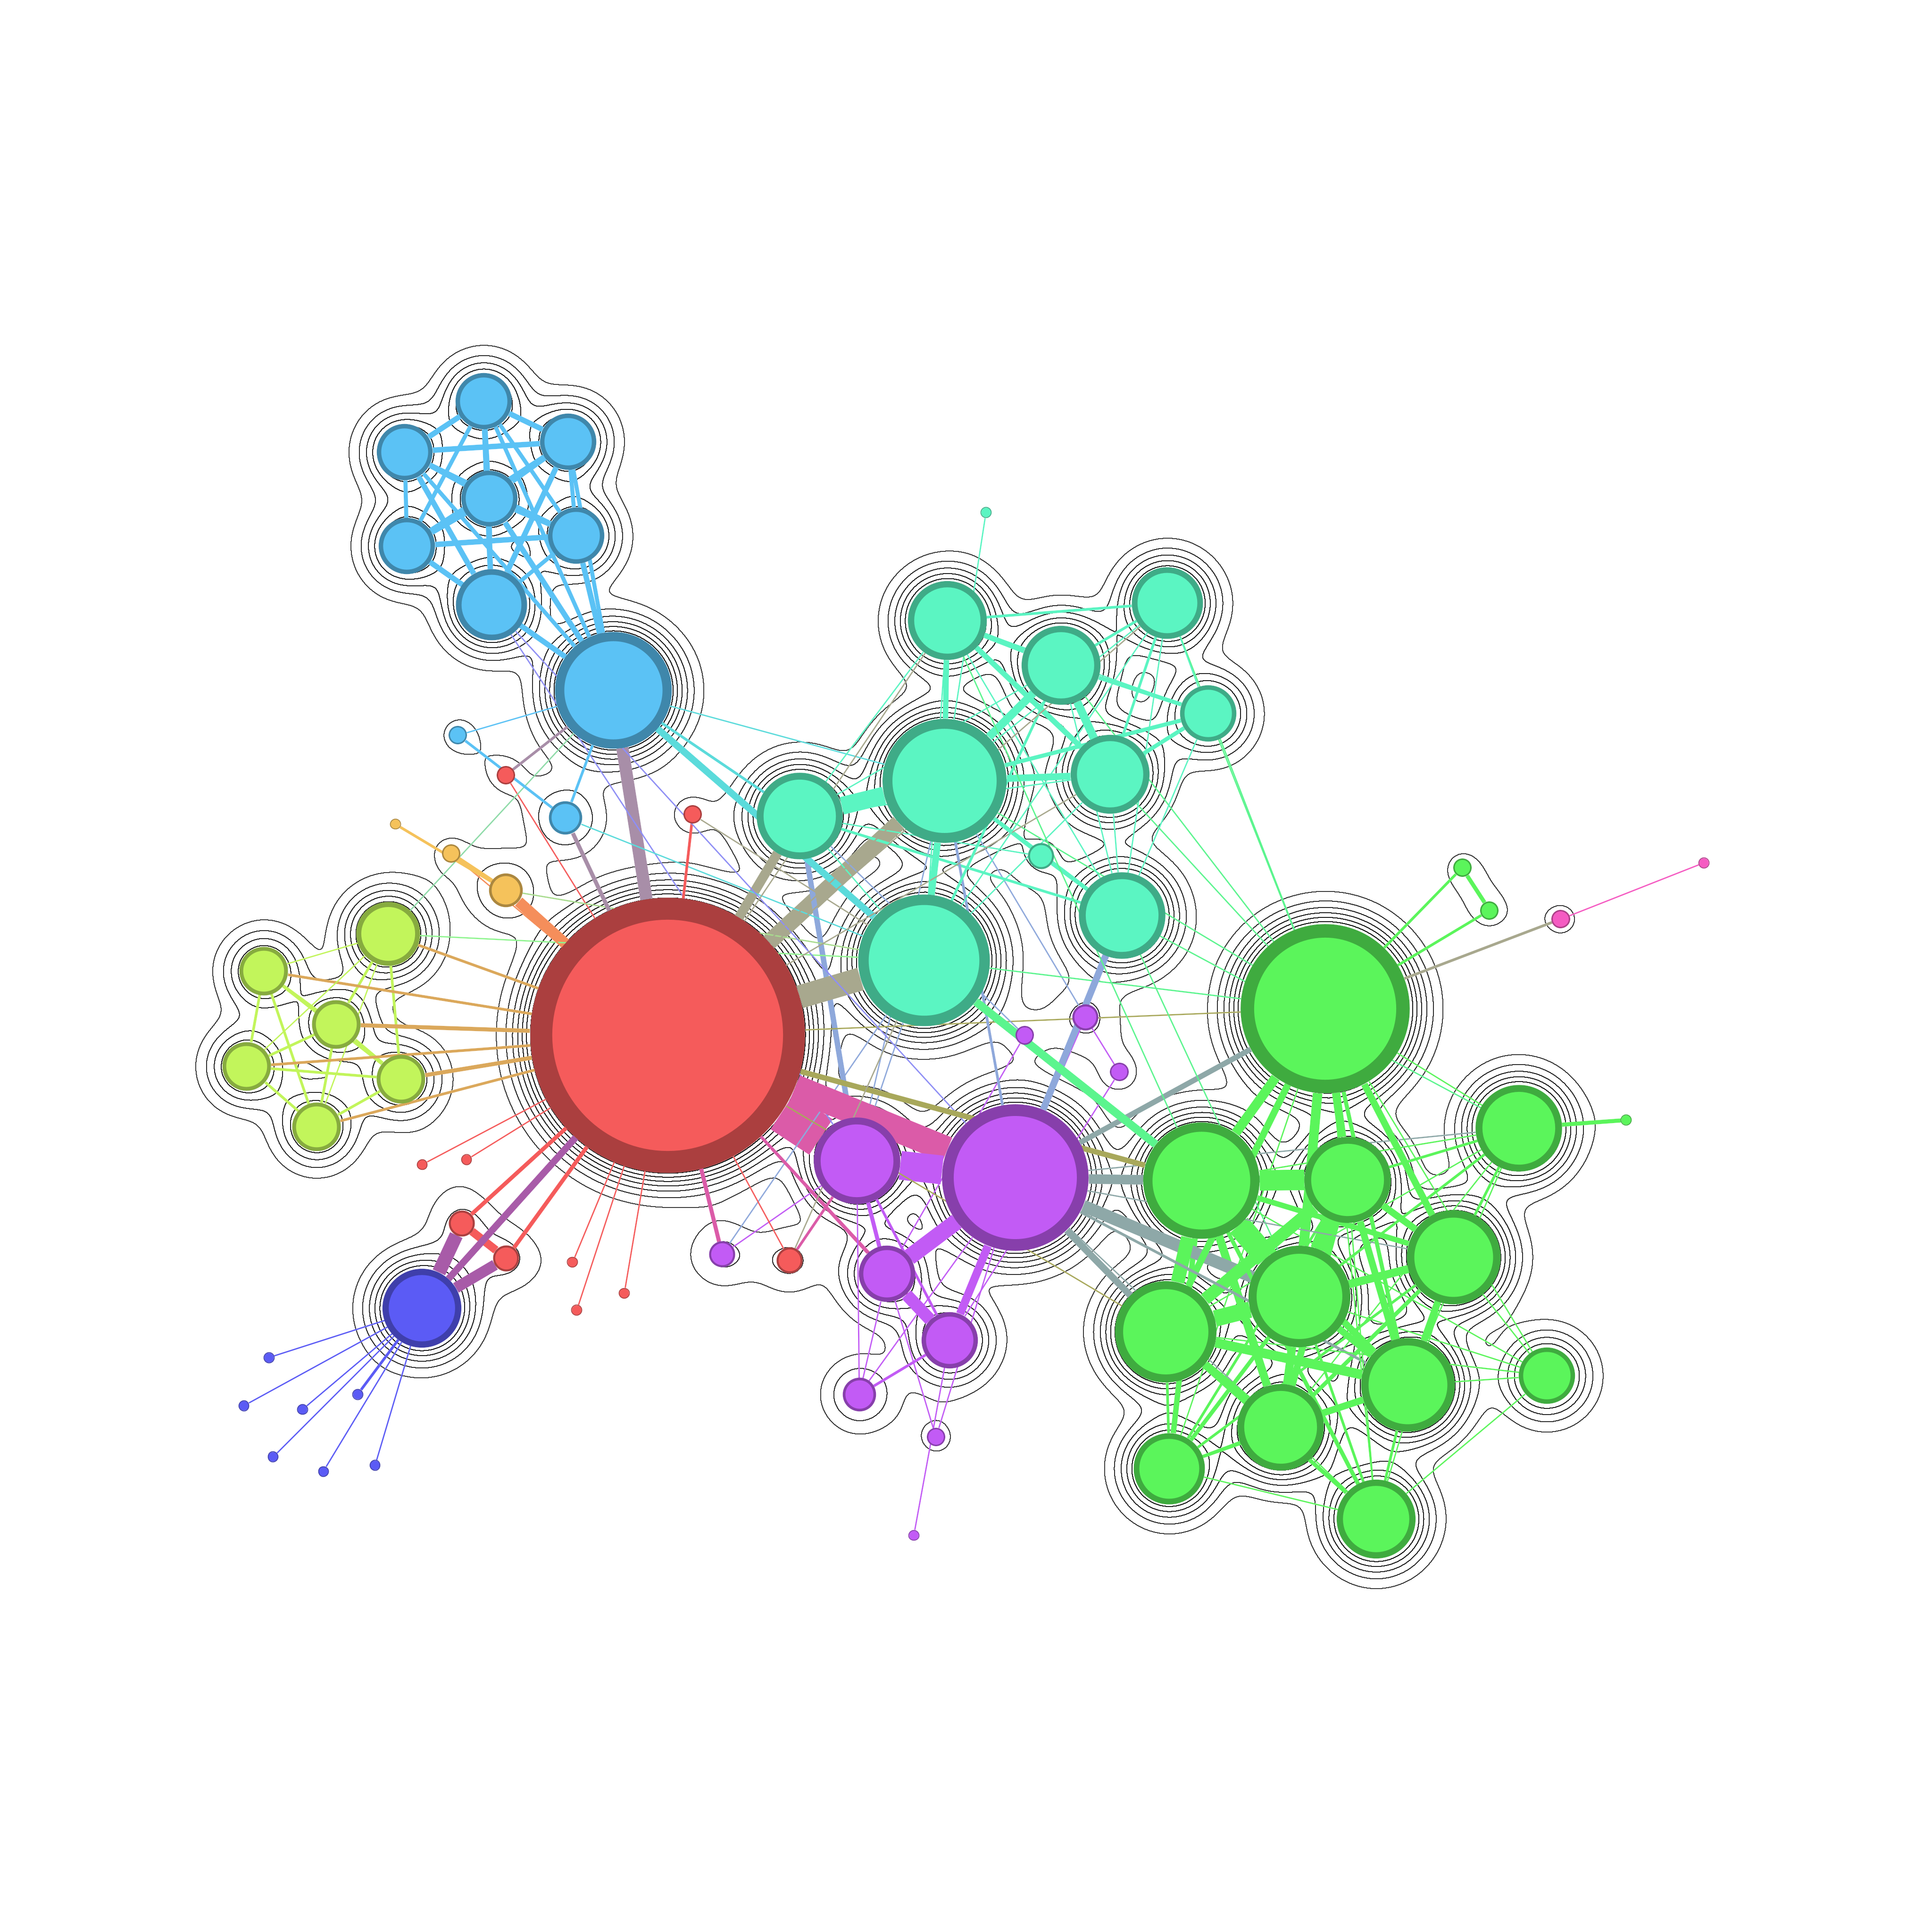
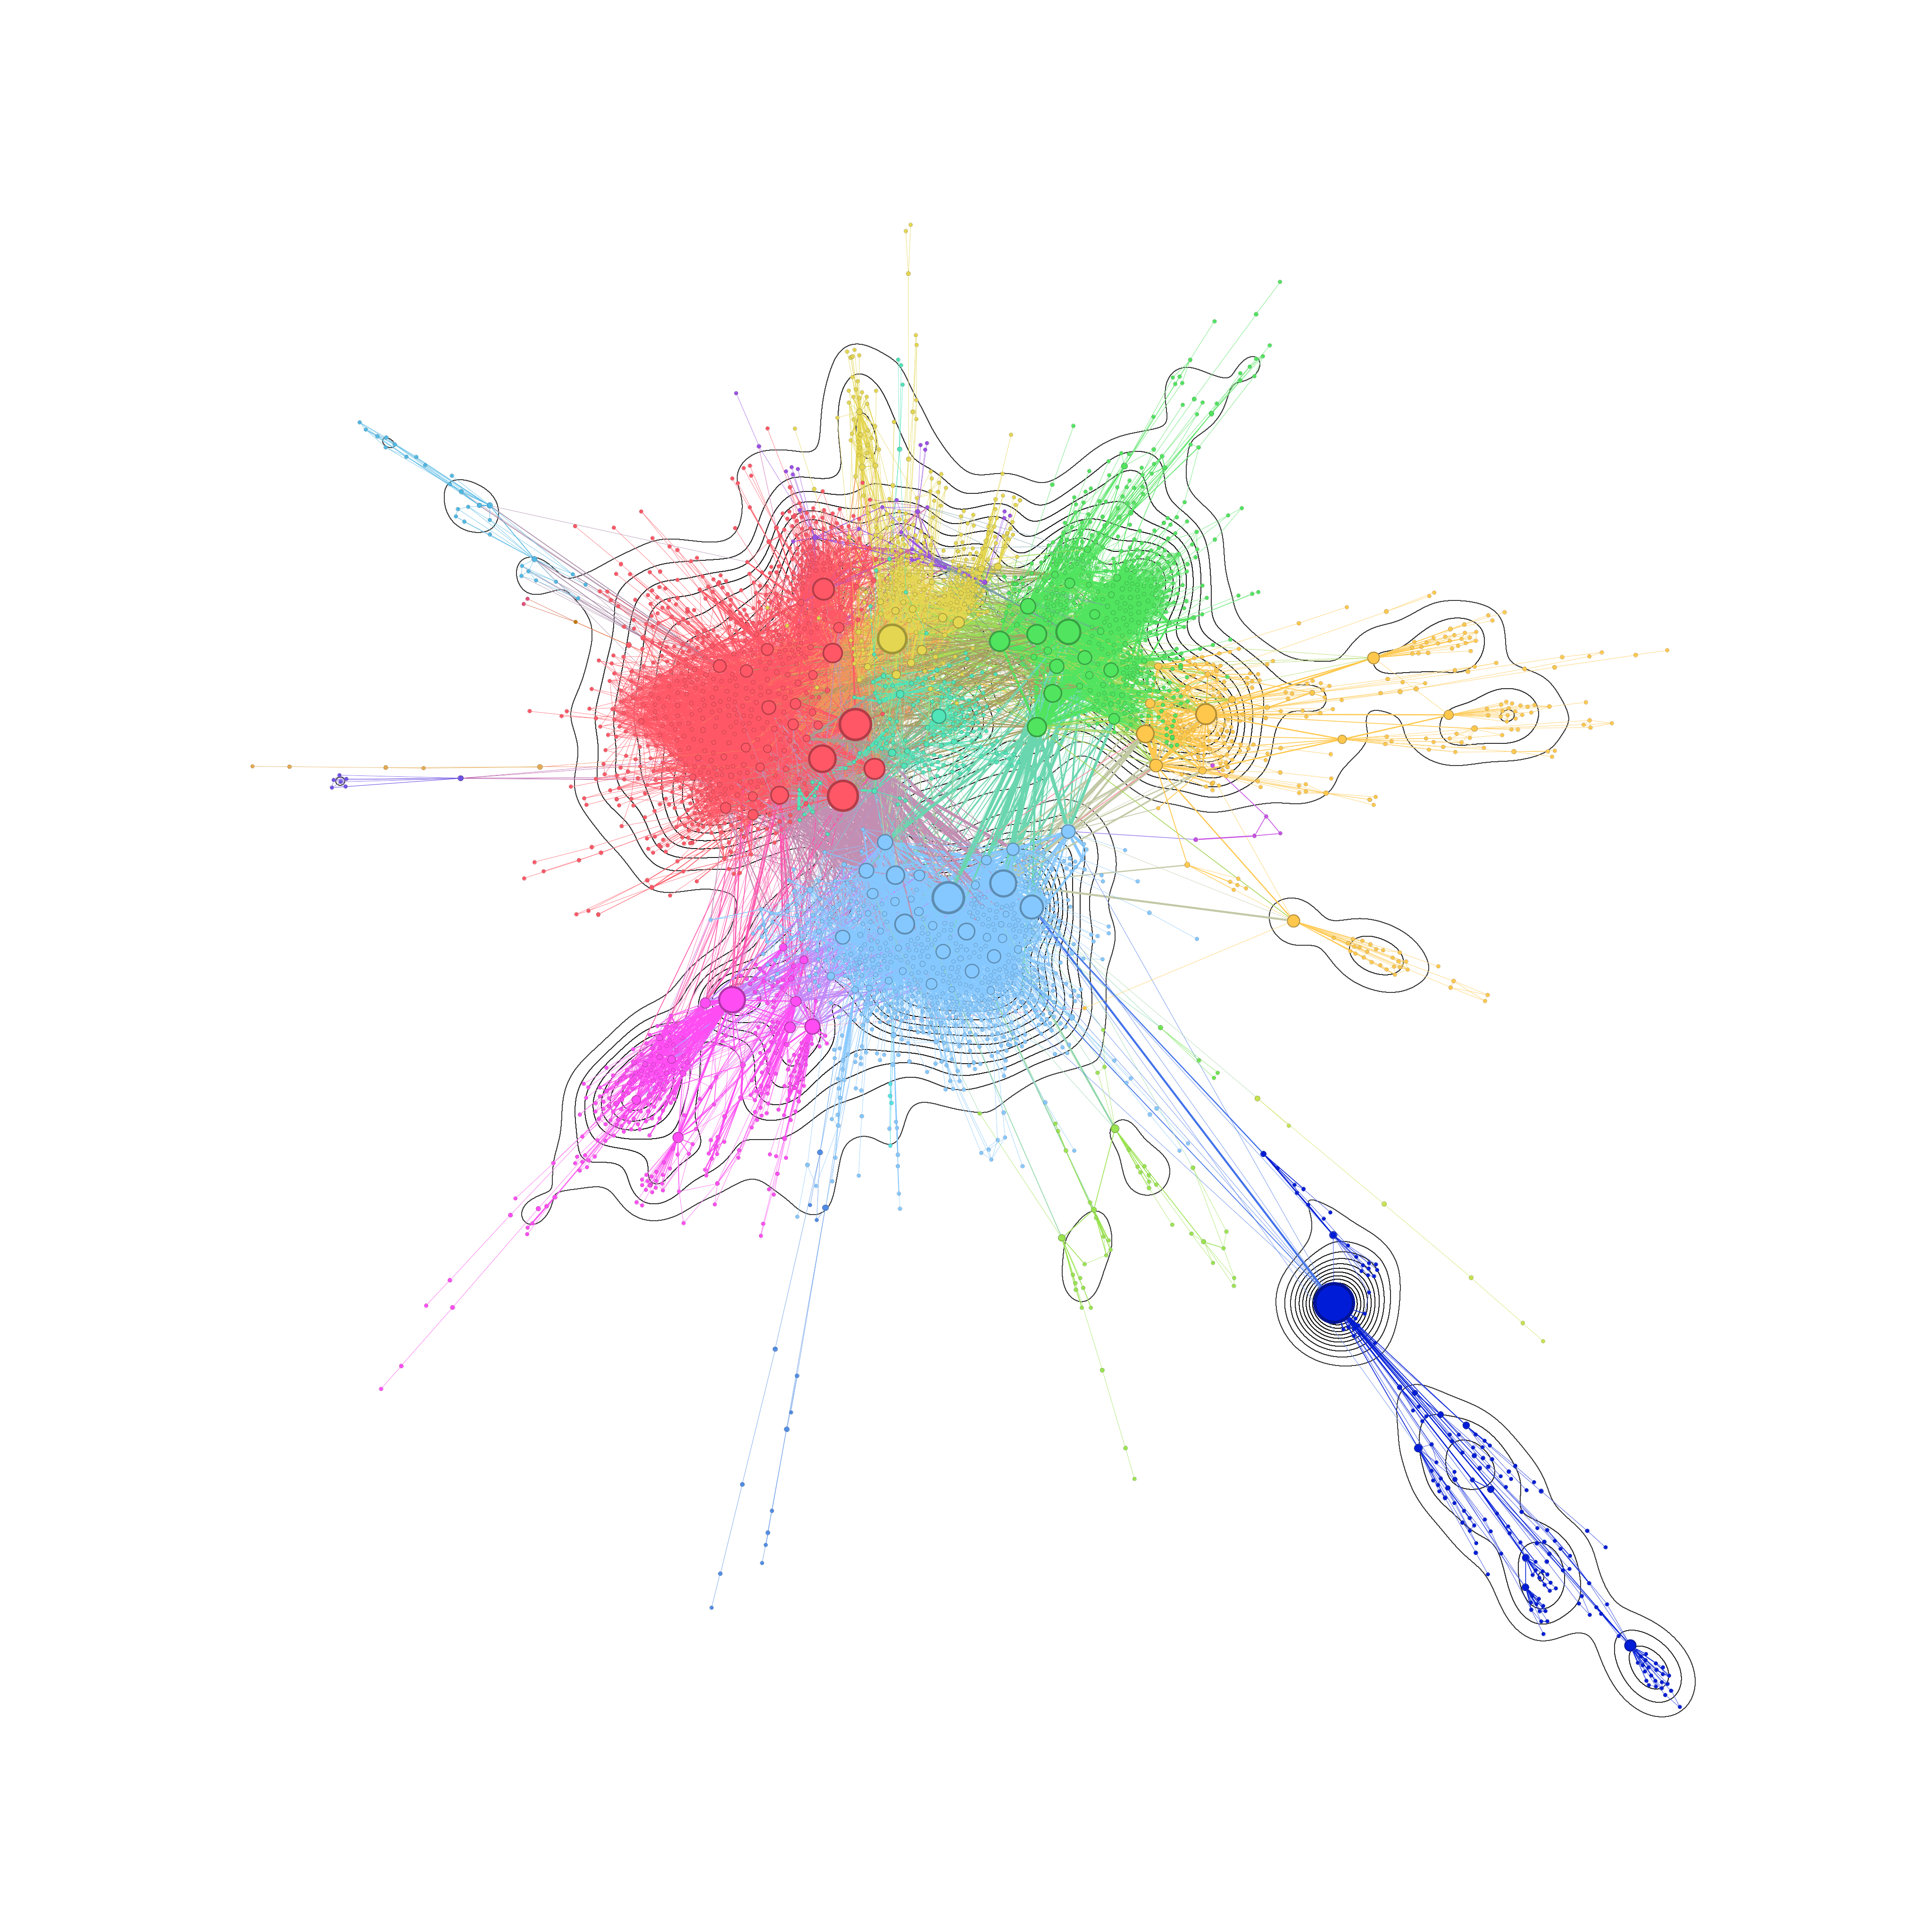
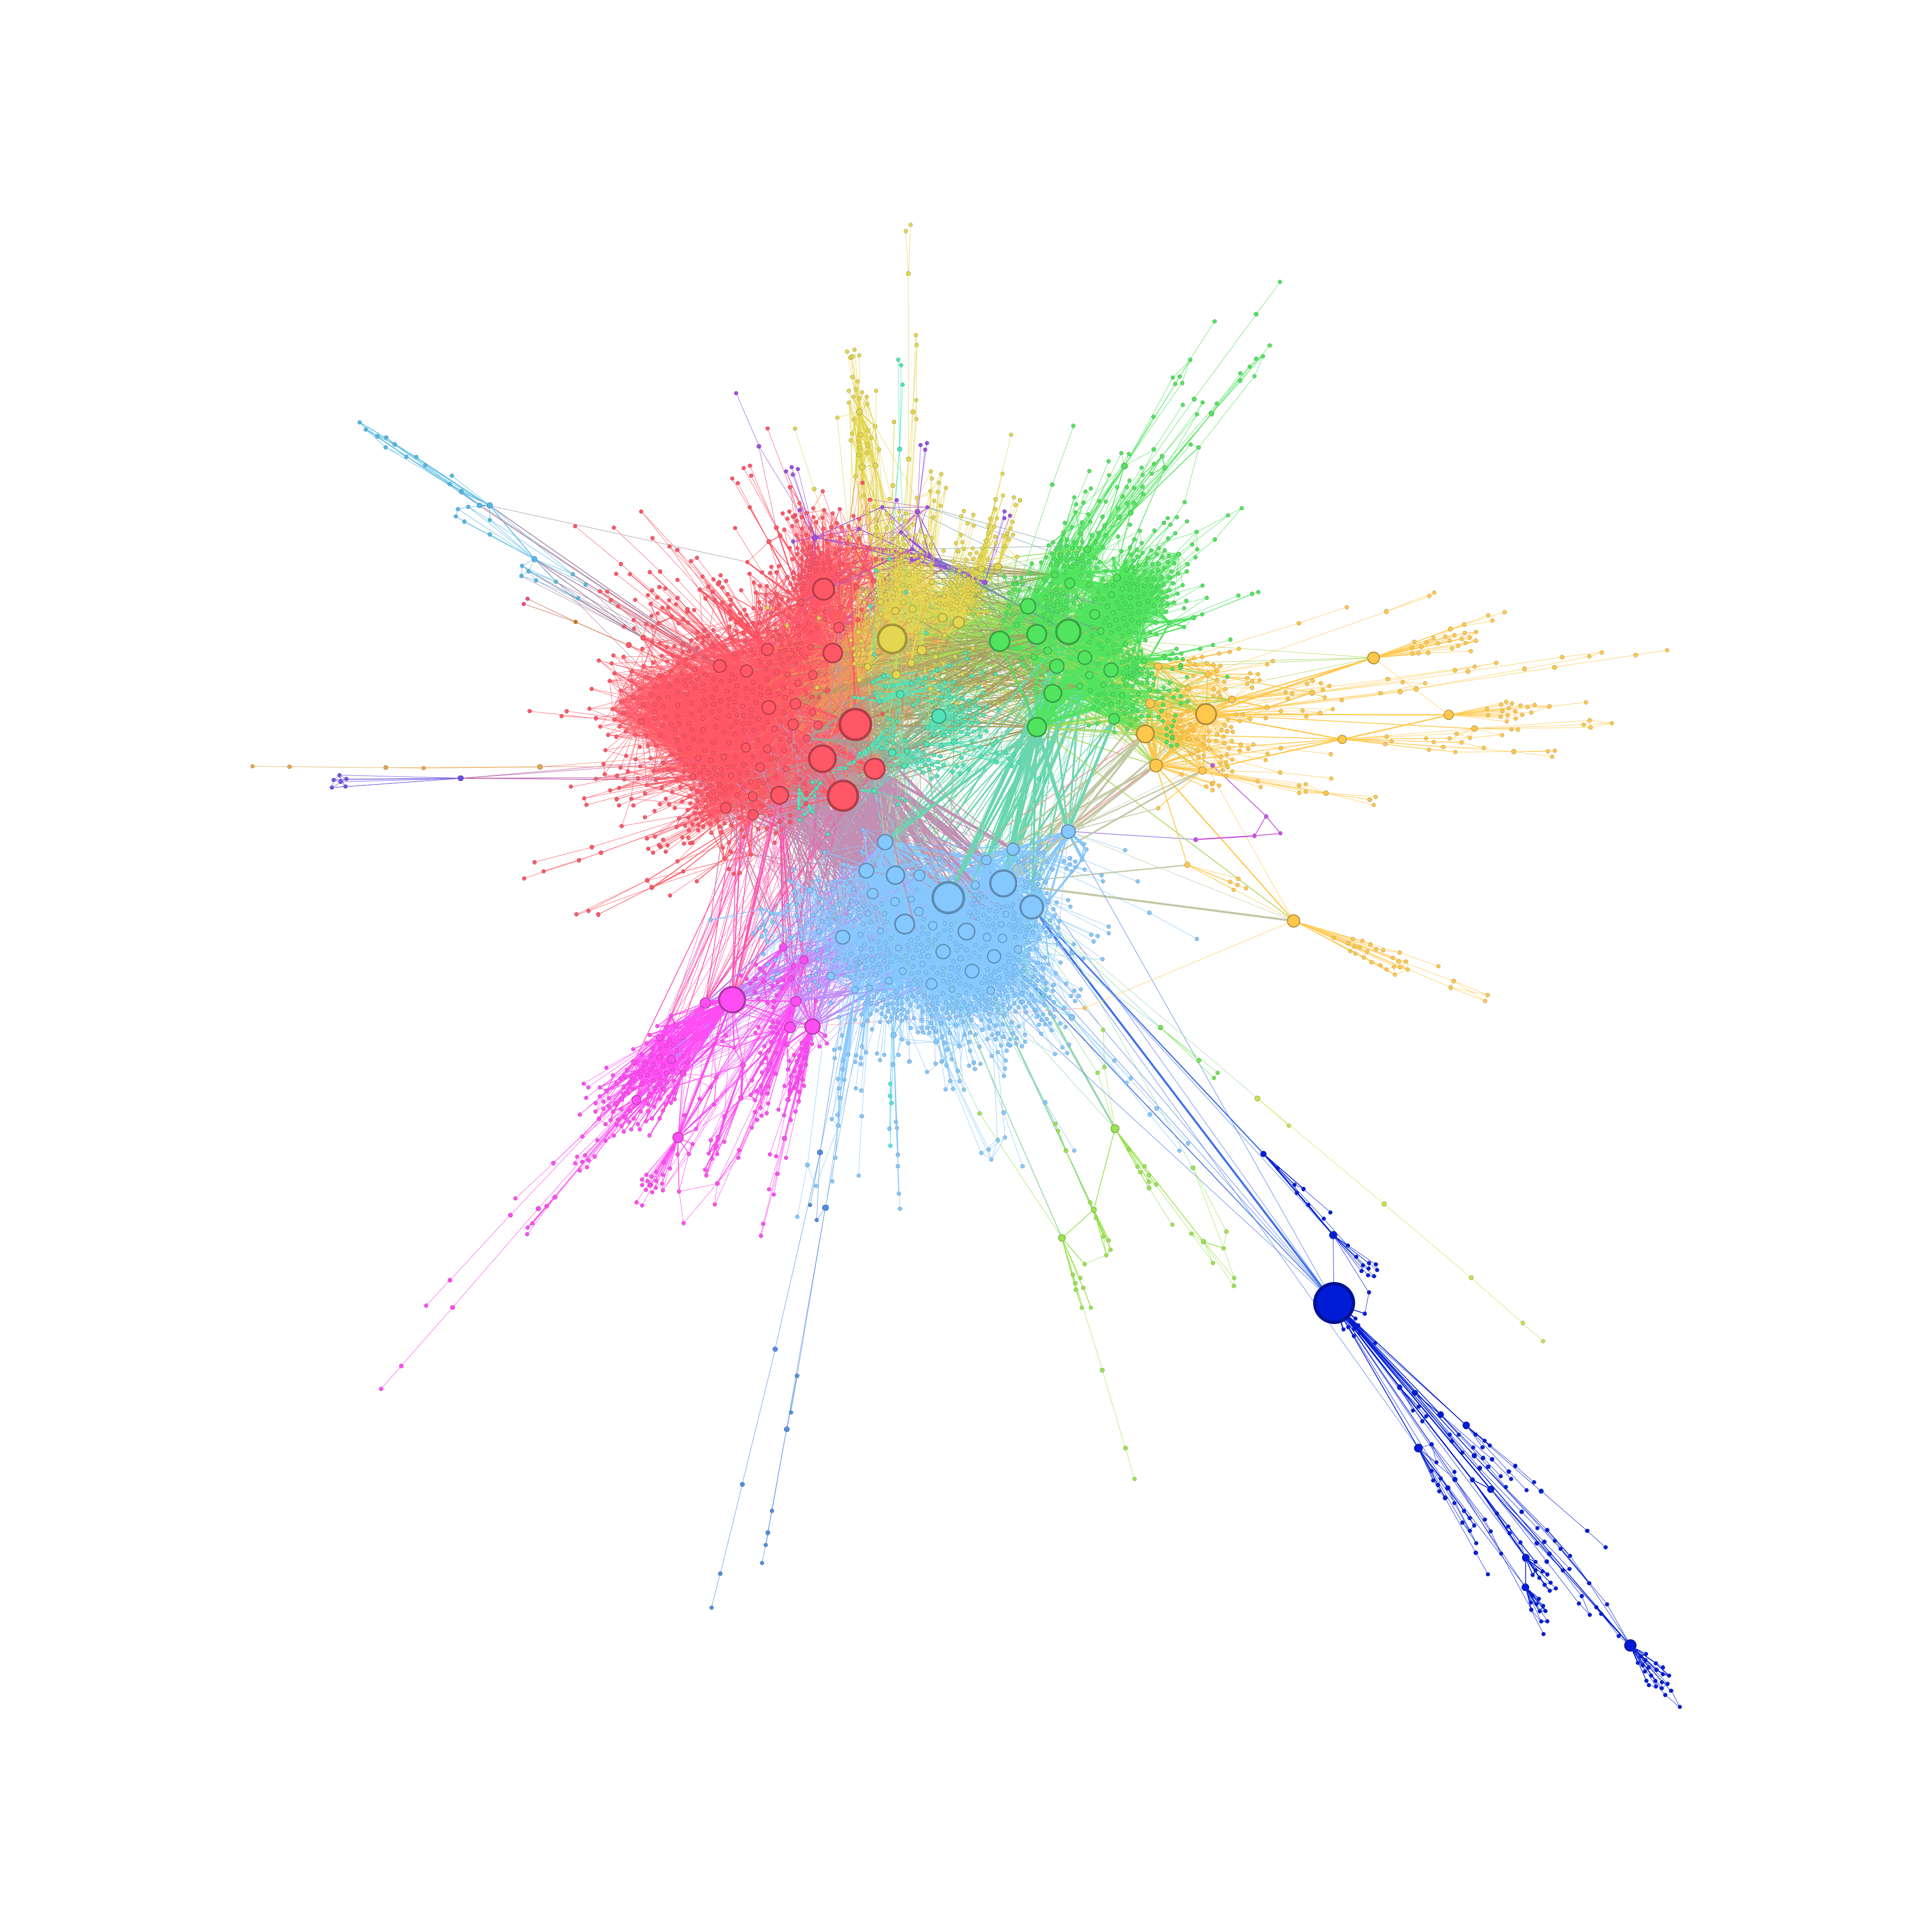
Export Network Graph
Take any network graph you have, the final effect will wokr better on graph that has a lot of clusters.
When you’re happy with your spatialisation in preview, we need to export in PNG 2 files with the following configuration:
background.pngwhere only the Nodes are rendered, use the Preview Settings to remove the node labels,the edges and the edge labels. Export this file with a certains option : 4096x4096, no transparant background, 0% marginforeground.pngwhere you can render the node and the edges, (label might be rendered, but might occur small issue later, I will come back). Export this file with a certains option : 4096x4096, transparant background, 0% margin.
Processing with Gmic
Let’s concider you exported the png in the same directory, and gmic is accessible on your terminal, run this command :
gmic.exe background.png fx_stamp[-1] 1,100,0,30,0,1,1,0,50,50 fx_channel_processing[-1] 0,0,0,1.22,2,0,100,256,0,0,0,2,0,0,50,50 samj_Colored_Outlines[-1] 0,0,16,0,2,0,0,0,255 fx_channel_processing[-1] 0,0,100,0,0,0,100,256,0,1,0,2,0,0,50,50 output[-1] intermediate.png
Quick explanation :
- fx_stamp: Convert the image to black and white and reverse it.
- fx_channel_processing: Apply a blur, this somehow simulate a Kernel Density Estimation. To simplify, the blur processing tries to genreate a density approximation on every point of the map.
- samj_Colored_Outlines: Create the isopleths. We could vugalirse saying it’s a quantization of the discrete density aproximation computed on the previous step.
- fx_channel_processing: Convert to black and white image
- output: Save the image to
intermediate.png
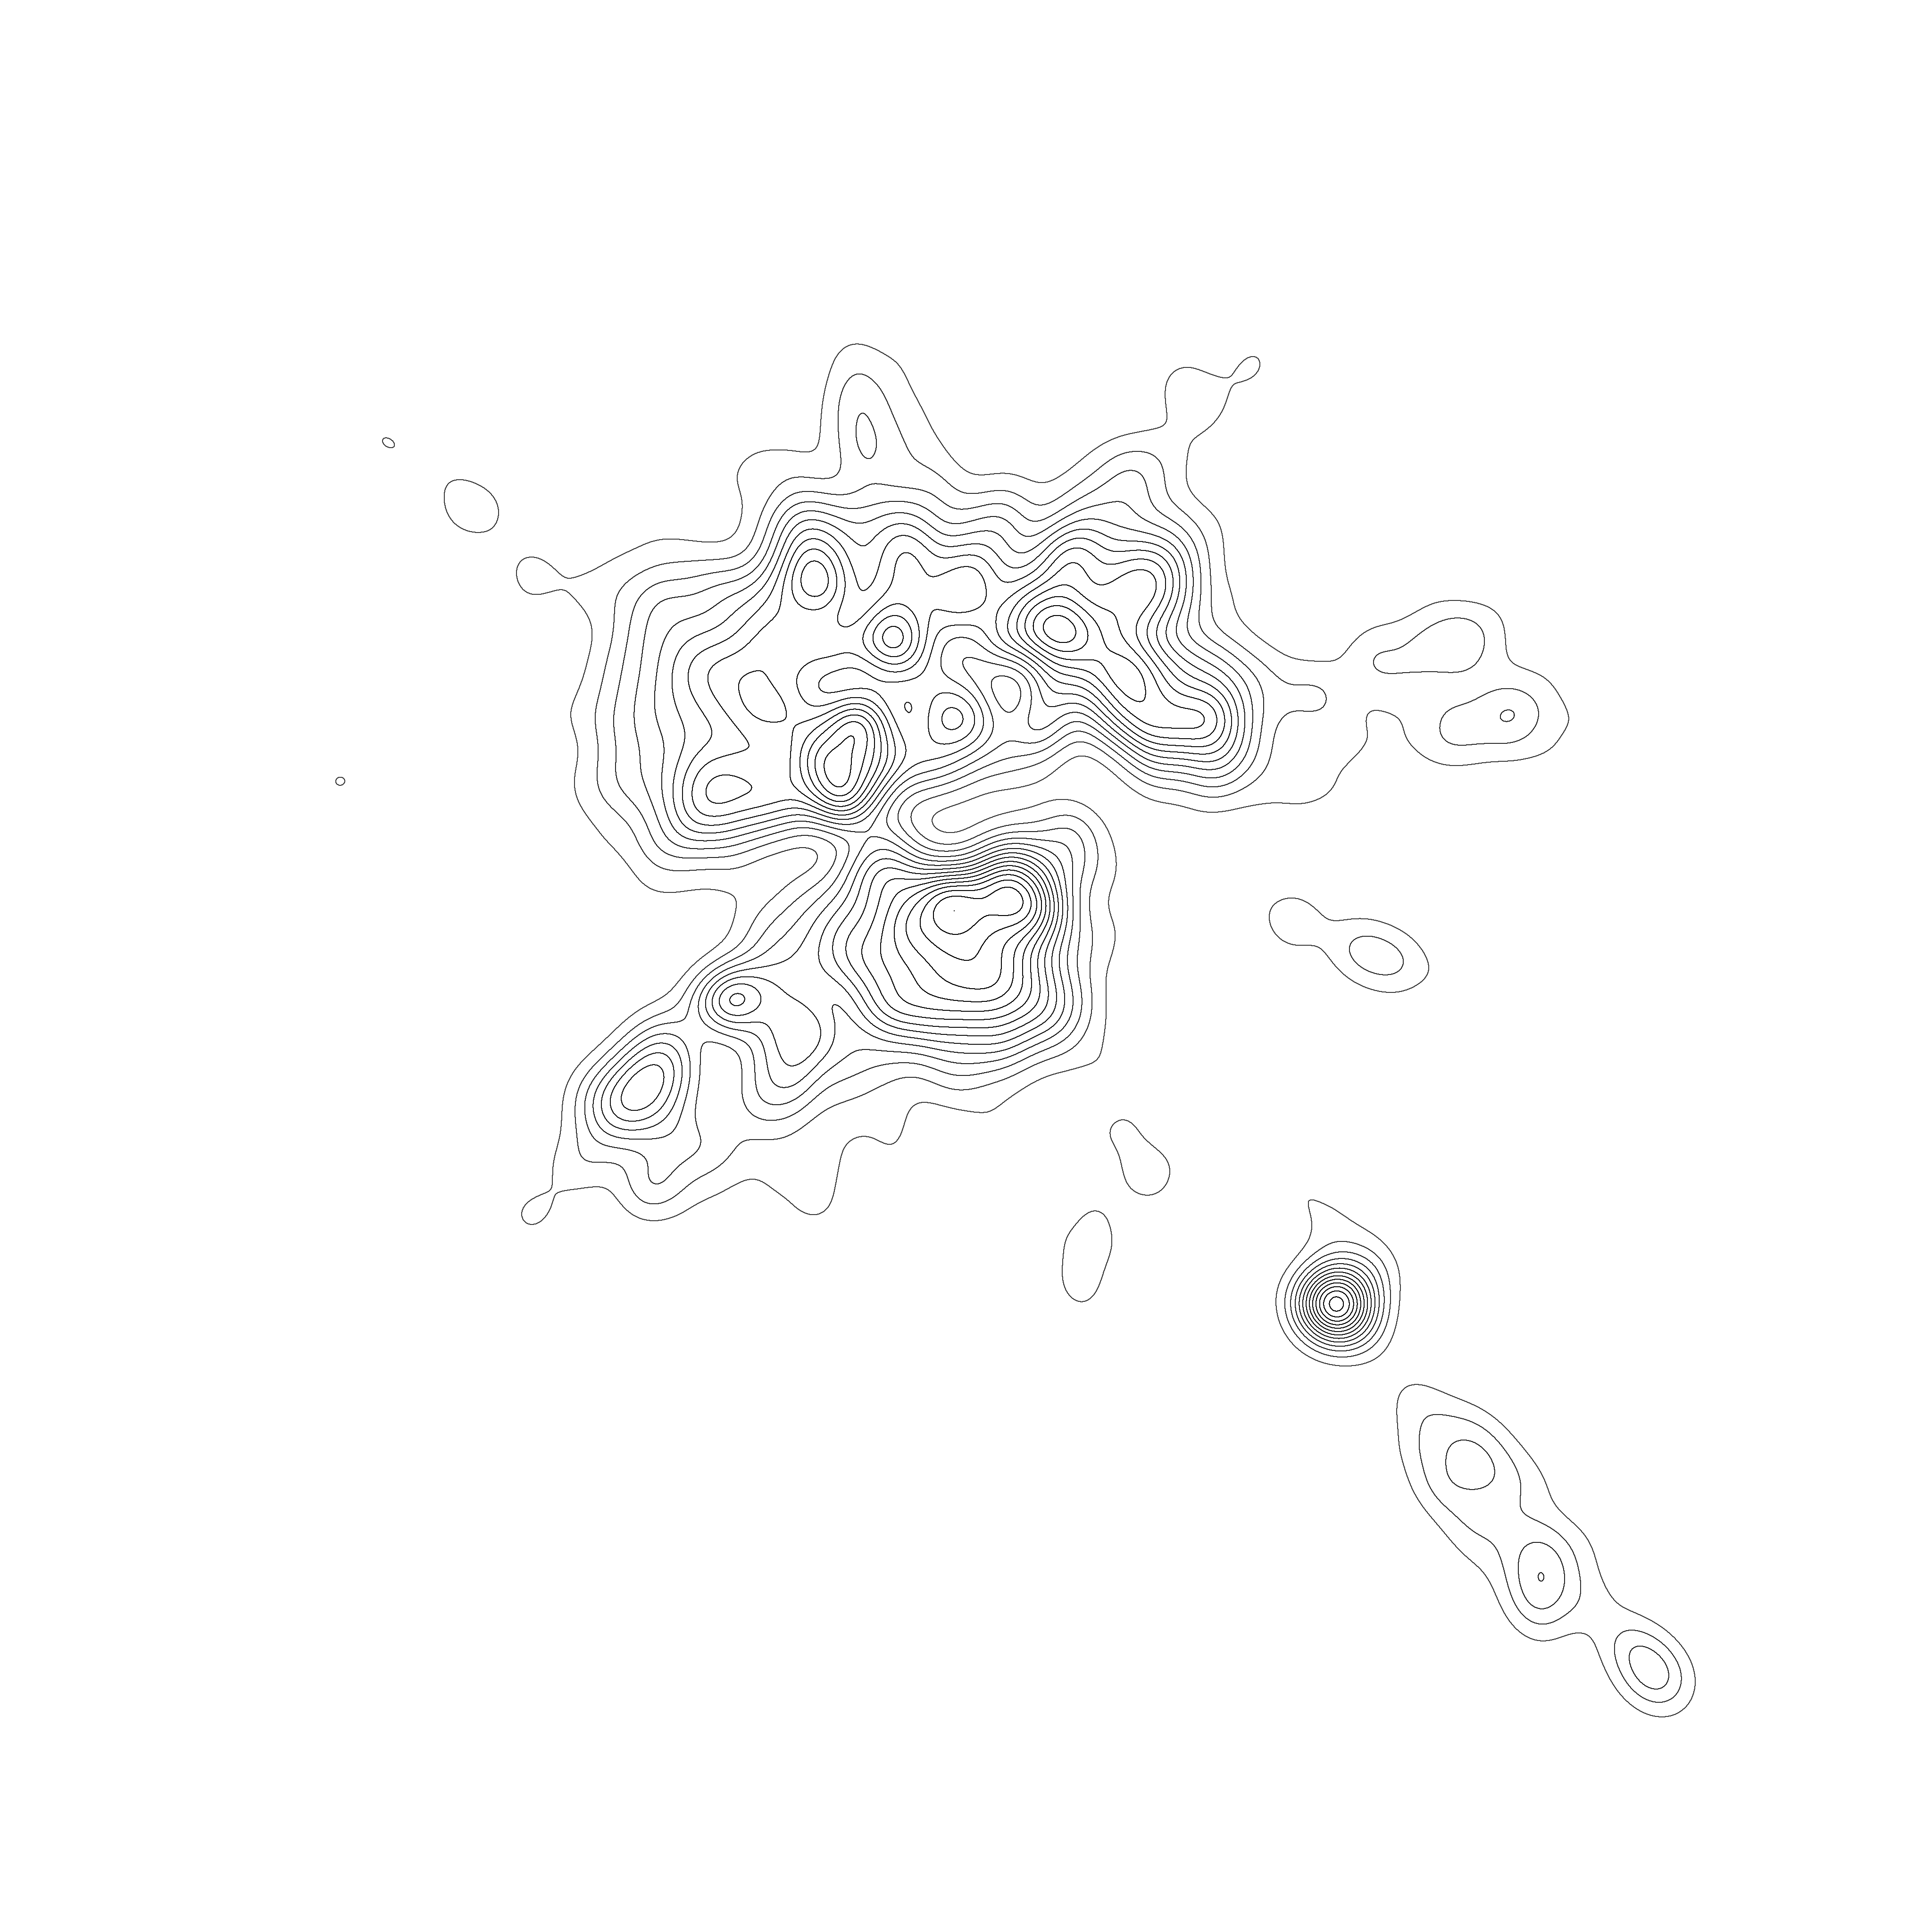
Then run this script :
gmic.exe intermediate.png foreground.png +channels[-1] 100% +image[0] [1],0%,0%,0,0,1,[2],255 output[-1] output.png
Here the script only compile the intermediate.png and foreground.png as one final image.

Comments
The process is still experimental, a lot of things may vary like the export size that asks to do reparametrization of the script. There is also some limitation due to current behaviour of gephi. If the foreground exports with node label, it might generate a image not aligned with the background which break the global effect at the end.
Out of that, the effect works well with networkt that has a certain critical mass of node density. Having the edges on the foreground hides a little bit the iso lines.
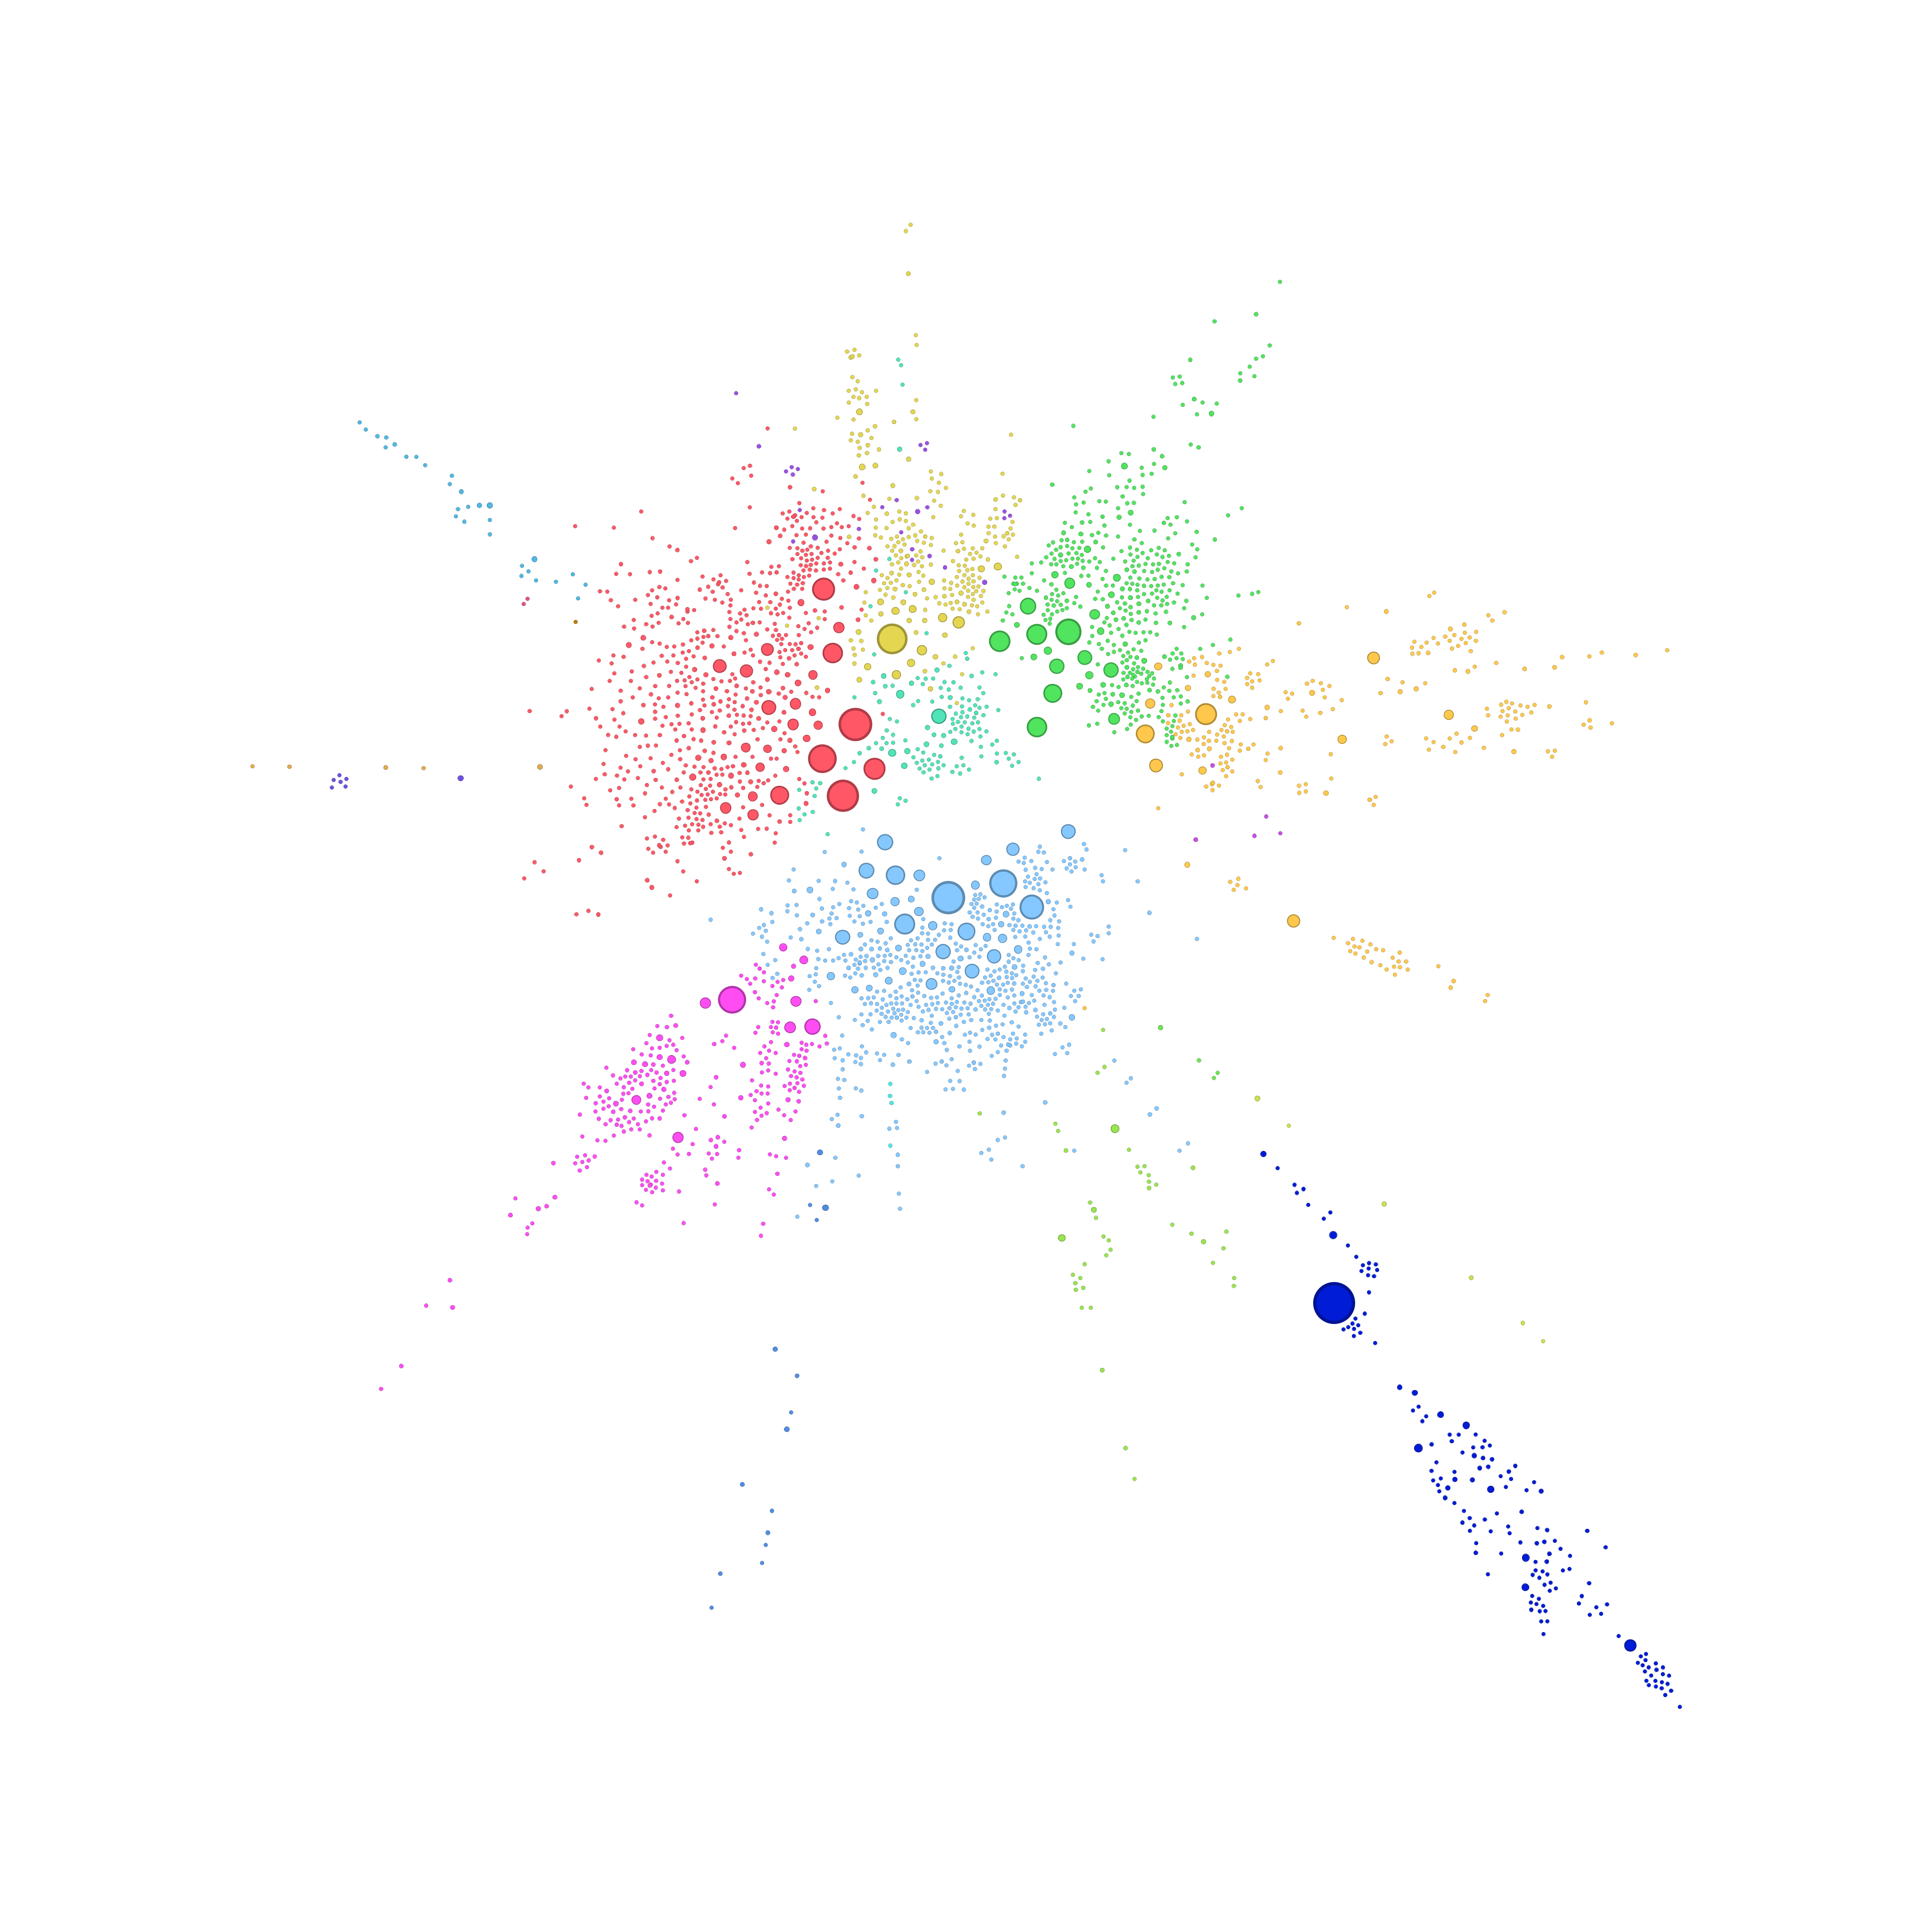
Some other experiments